
Tracing
A long run is thousands of tool calls across several agents. hmz trace collect turns what they left behind into one timeline you can actually look at.
It works whether or not a flow drove them — a trace of yesterday's claude session is one command away.
Collecting
hmz trace collect~/.humanize/cycles/-home-you-code/20260809T014455.212Z-9f21ab/traces/20260809T014455Z.trace.json of 20260809T014455.212Z-9f21ab: 3 sessions, 412 slicesDrag that file into ui.perfetto.dev, or open chrome://tracing and load it. It is a Chrome JSON trace, so anything that reads one will do.
A trace goes with the run it is a trace of. A cycle already holds what happened, a link to every log each session was written to, and whatever the flow left behind, so the trace belongs there rather than in whatever directory you happened to be standing in. The default name is the UTC moment it was collected, so collecting twice keeps both traces rather than writing over the first; --output puts it somewhere else, its directory created if it is not there.
What it prints is that path, then the name of the run it is a trace of, then the counts. A run that was profiled has a third of them — 1 session, 10 slices, 3 programs — and a trace of sessions alone stops at the slices.
The same thing is a row of /cycles in the interface: pick the run, press enter, and collect it there.
Full syntax in the CLI reference.
Reading the trace
process   agent          builder · 4 sessions
  track     main ──────────────▶ ▓▓▓ ▓ ▓▓▓▓▓▓ ▓▓  ▓▓▓▓▓  ▓ ▓▓▓▓
  track     subagent · explore ▶      ▓▓▓▓▓▓▓▓▓▓▓
process   agent          reviewer · 2 sessions
track main ──────────────▶ ▓▓▓▓ ▓▓▓▓| In the trace | Is |
|---|---|
| a process | one agent and everything it drove, called <agent> · <n> sessions — or, for a profiled run, one program it ran, called <program> · <pid> |
| a track | one row of that agent's sessions: main for the ones somebody started, subagent for what a turn reached for. Sessions of one agent that never run at the same time share a track; root sessions and sub-agents stay apart. Or one thread of that program. |
| a slice | one action — a tool call, a message, or waiting for reasoning |
A row of sub-agents that were all started as the same kind is named after that kind — subagent · explore rather than five names run together — and a sub-agent that started one of its own is subagent 2. A second row at the same depth is #2 after the name, and actions that do overlap inside a row spill into lanes of their own, ~2 after it.
Click a slice and its arguments are there: the prompt, the reasoning, the tool input, the tool output. As much as the backend wrote down.
The document's otherData says what was asked for and what was collected — the workspace, the sessions named, the agents and backends found, how many sessions, slices and tracks there are, and the first and last moment in it. A profiled run adds programs, how many of them were drawn; a trace of sessions alone does not carry the key at all.
What counts as one agent
An agent is one configuration — a backend at a model at an effort — together with every sub-agent it started. So a Ralph loop of a hundred one-shot sessions reads as one agent rather than a hundred, and a sub-agent belongs to the agent of the session that started it, whatever it ran at itself.
That default is a guess, and it has a blind spot: two agents at the same configuration are indistinguishable, because the backends log a session under an id and never say whose it was. An actor and its reviewer at one model and one effort would read as one agent.
A run that drove the sessions itself knows better. hmz trace collect reads that from the run it is tracing, so rlar traces as actor and reviewer without being told anything. Driving agents by hand, say so yourself:
collect(agents={a.id: a.opened for a in (actor, reviewer)})Sessions nobody claims are read as the configuration they ran at.
Cycles
Every run of a flow is one cycle, written as it happens, and a cycle is a directory:
~/.humanize/cycles/<workspace>/<datetime>-<hex>/
    cycle.jsonl                     what happened, a line at a time
    state.json                      what a flow that can be picked up again left behind
    profile.jsonl                   the programs it ran, for a run that was profiled
    sessions/<session>/…            a link per file the backend logged that session to
    traces/<datetime>.trace.json    what was gathered of it afterwards
<workspace> is the absolute path with everything that is not a letter or a digit flattened to -, the way the backends flatten a workspace into the folder they log it under. <hex> is six characters, because two flows may be started in one millisecond and neither is the other's run.
cycle.jsonl is JSON lines, one line per thing that happened to the run, appended and flushed as it goes — a run that died is a run whose cycle still says what it got to.
event | Written | Carries |
|---|---|---|
began | when the flow starts | flow, task, workspace, whether the flow is resumable, the run it was picked_up from where there was one, and one entry per agent with its agent id, backend, model, effort, permission, provider, goals and whether it was the person at the prompt |
opened | each time an agent opens a session | agent, backend, provider, session, the name the run gives it and where its links are |
ended | when the flow stops | how: done, failed, or stopped |
sessions/<session>/ is a link per file that session was logged to, named for whose session it was, what took its turns, which account they ran as and what the backend called it — builder-claude@work-0a1b2c3d, and @local where the turns ran as the account this machine is already signed into rather than one humanize keeps. They are there to be read: humanize itself reads and writes every log where the backend keeps it.
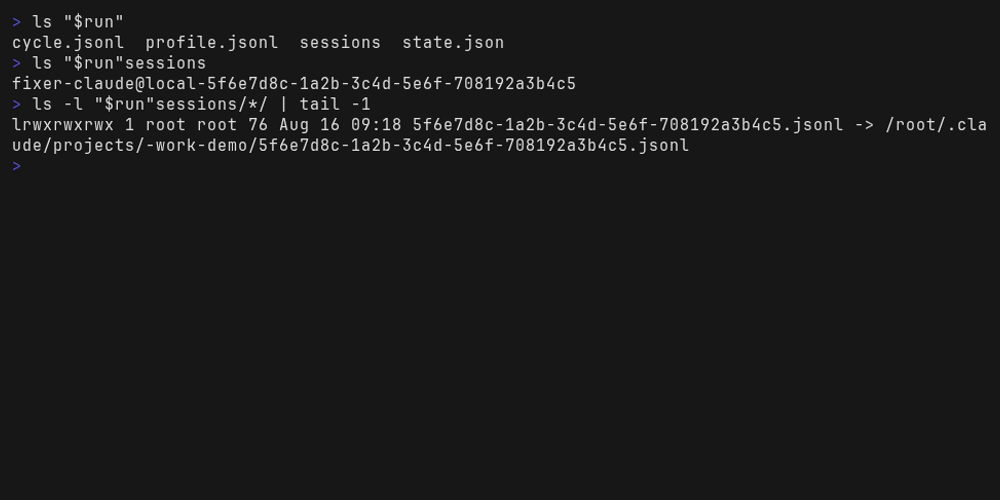
The links are made when the session opens and made again when the run ends, since a backend goes on writing a log after the turn that opened it and a sub-agent's transcript appears whenever that sub-agent ran. A filesystem that will not make one is a run without links rather than a run that stops.
It is not a transcript. The backend's own log is the turn-by-turn record, and a cycle is not a second copy of it. What is kept here is the shape of the run — enough to gather a trace afterwards out of the ids alone.
A cycle covers one run. It closes when the flow finishes, fails or is interrupted, and a closed cycle is never reopened: running the flow again is another run, with sessions of its own, and so another cycle.
That is what state.json, resumable and picked_up are for. A flow that says @flow(resumable=True) takes a state dict as its last argument, and what it writes there is state.json in the cycle of the run that wrote it, keyed by the name the flow was run under. Running that flow again here carries on from the last run of it that left anything — into a cycle of its own, whose began line says which run it was picked_up from, so a week of stops and starts reads as the week it was. /cycles picks a named run up: enter on a row offers carry on from here, which is asked of the flow rather than of the run, a flow being a file that may have been rewritten since. See Picking a run up and a flow that can be picked up.
An agent stopped by hand makes the run stopped rather than failed, whatever the turn under way made of it — so a run you ended is written down as one you ended.
from hmz.cycle import cycles, opened

for cycle in cycles():                 # this workspace, oldest first
    print(cycle, opened(cycle))        # {"actor": ["0a1b…", "5f6e…"], "reviewer": [...]}
Profiling a run
An agent's turn is mostly other programs. It runs the tests, it builds the thing, it greps the repository — and none of that is in a backend's log, which records the tool call rather than the process. So a workspace may ask for its runs to be profiled as well as traced, on the second page of /settings:
3. profile on profile the programs a run here startsWhile the flow runs, the programs underneath it are sampled — what each was, what started it, and how long it took — into profile.jsonl in that run's own cycle. Collecting the run puts them in the same document as its sessions, drawn the same way: a process is a program and a track is one of its threads, exactly as a process is an agent and a track is a row of that agent's sessions.
That is the point of one document rather than two. An agent's timeline and a profiler's timeline at one scale means what was this run doing at 09:41 has one answer:
process   agent          builder · 4 sessions
  track     main ──────▶ ▓▓▓ ▓ ▓▓▓▓▓▓ ▓▓  ▓▓▓▓▓  ▓ ▓▓▓▓▓▓▓▓▓▓
process   program        pytest · 41207
  track     main ──────▶       ▓▓▓▓▓▓▓▓▓▓
It is sampled rather than intercepted: nothing goes between an agent and what it runs. A program that lived for thirty milliseconds may be missed, and a machine whose processes cannot be read is a run with no profile rather than a run that stops.
Where the trajectories come from
The backends' own home directories, which humanize only reads:
| Backend | Environment variable | Default |
|---|---|---|
| Claude Code | CLAUDE_CONFIG_DIR | ~/.claude |
| Codex | CODEX_HOME | ~/.codex |
| DeepSeek Harness | DSH_HOME | ~/.dsh |
| Kimi Code | KIMI_CODE_HOME | ~/.kimi-code |
Those four, and no others. opencode, mimocode and Antigravity keep a session in a database rather than in a log file, and nothing here reads pi's, Grok Build's or Qwen Code's own logs yet, so there is nothing to gather for those: a run of theirs is watched as it happens rather than collected after.
A home that does not exist is skipped rather than being an error, so collecting on a machine with only one backend installed works — and so is a backend humanize has no reader for, whose home being there changes nothing.
What one trace holds
A trace is of a run, and holds the sessions that run opened and no others:
hmz trace collect                                    # the last run of this workspace
hmz trace collect ~/code/other                       # the last run of another workspace
hmz trace collect --cycle 20260809T0144              # that run of it, by name
hmz trace collect --start "3 days ago"               # and only what it did since
The run wrote down which sessions its agents opened, and those ids are what the trace is gathered by — so a directory run in fifty times has fifty traces to collect and none of them holds another's work. A run that opened nothing is a trace of nothing rather than a trace of whatever else the directory has seen. Asked for by id and not by directory, which is why a flow that ran on a machine of its own — working in a mirror, logged under a path this workspace has never heard of — is in its own trace all the same.
--cycle takes a run's directory name or a leading part of it; without one the run is the last of the workspace. A name no run of the workspace begins with is a usage error.
Or of a directory, whoever opened its sessions, which is how an afternoon at a coding agent that no flow ever drove is read back:
hmz trace collect --all                              # every session of this workspace
hmz trace collect ~/code/other --all                 # every session of another
hmz trace collect --session 0a1b2c3d,5f6e            # two sessions, wherever they ran
hmz trace collect ~/code/other --session 0a1b2c3d # that session, only if it ran there- Naming sessions alone collects them wherever they were recorded.
- Adding a workspace keeps only the named sessions recorded there.
--allcollects the workspace, whichever run opened what is in it and whether any did.
A session is named by its whole id, by the key the trace shows it under, or by a leading part of either — and the sub-agents it started come with it.
Neither of these is a trace of any run, so neither is written inside one: they go to ~/.humanize/cycles/<workspace>/, beside that workspace's runs. Asking for both at once — --cycle with --session or --all — is a usage error rather than one of them quietly winning. And neither is offered in the interface: /cycles is a list of runs, and a trace of what is not one has nothing there to be reached from.
A workspace nothing has ever been run in has no run to trace, so a bare hmz trace collect there collects the directory itself.
--start and --end take anything dateparser understands and cut records outside the range, either way. A time that cannot be read is a usage error. --output wins over where any of these would otherwise land.
From Python
from hmz.tracing import collect

document = collect(
    "~/code/myproject",             # or None, for sessions asked for by id alone
    sessions=["0a1b2c3d"],          # a string or an iterable of ids
    agents={"actor": [...]},        # what each agent opened
    output="trace.json",            # omit and nothing is written
    start="3 days ago",
    end=None,
    profile=cycle / "profile.jsonl",  # the programs that run started, if it was profiled
)
Returns the trace document. Writes a file only when output is given — which is the one thing the library does that the command line does not let you skip.
sessions unset is every session of the workspace; an empty sessions is no session at all, which is what the trace of a run that opened none holds. Naming sessions is a filter, and naming none of them is not the same as naming all of them. Collecting a run's own trace is that call with the ids the cycle wrote down and no workspace — which is what hmz trace collect and /cycles both do.
Raises ValueError if a time cannot be read or a named session is empty; the command line reports both as usage errors.
Watching a run instead
A trace is for after. While a run is going, the interface's /status shows the same shape live: who is working, every handover between agents with how often it happened, and what each model has cost with the rate it is costing it at.
That is read from the turns going past and from the logs the backends write as they go — never by asking the flow, which is a Python file that may branch any way it likes. See TUI.